10 Unique Visualizations of the NBA
 Come back quick, basketball.(Photo by TJ Dragotta on Unsplash)
(Originally published on Towards Data Science)
I miss the NBA.
The suspension of the NBA due to the COVID-19 pandemic is just one of the small disruptions in the world today. But like many other sports enthusiasts, I miss the thrill of watching live sports.
So I dealt with it, the same way any Data-loving, basketball enthusiast would: I dove into the stats, and built some graphs.
I used Tableau (something I only recently learnt how to use, but absolutely love already) to build these plots, and a dataset I found on Kaggle, which contains information about all players who’ve played in the NBA from the 1996–97 season to 2019–20 season.
Before I even started, without creating a single graph, I immediately stumbled upon my first interesting insight:
There have been only 2235 unique players in the NBA since 1996.
That’s an insanely low number, for 24 years of basketball. And that’s why we keep hearing experts say that getting into the NBA is like “winning the lottery”.
Before the NBA
College basketball is the typical recruitment point for the NBA, with most players turning pro after a successful college basketball career. Tournaments like NCAA March Madness are extremely popular, and players who shine in these tournaments catch the eye of NBA recruiters.
1. What are the most successful colleges, in terms of getting players to the NBA?
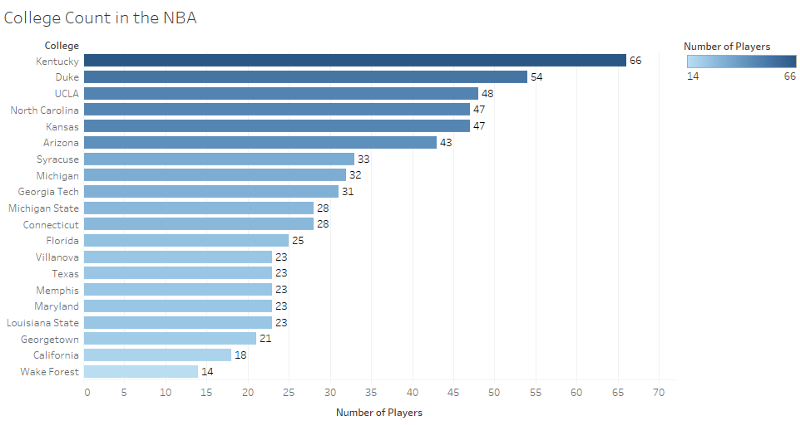
These are the top 20 colleges in the US in terms of players who have gone on to play in the NBA.
The top 3 colleges are The University of Kentucky, Duke University and the UCLA are the most successful colleges with 168 players going on to play in the NBA.
Players are typically drafted from colleges in different draft rounds. Being a first-round draft pick, means you’re the best of the best.
2. But does the draft round affect how many games the player ends up playing per season?
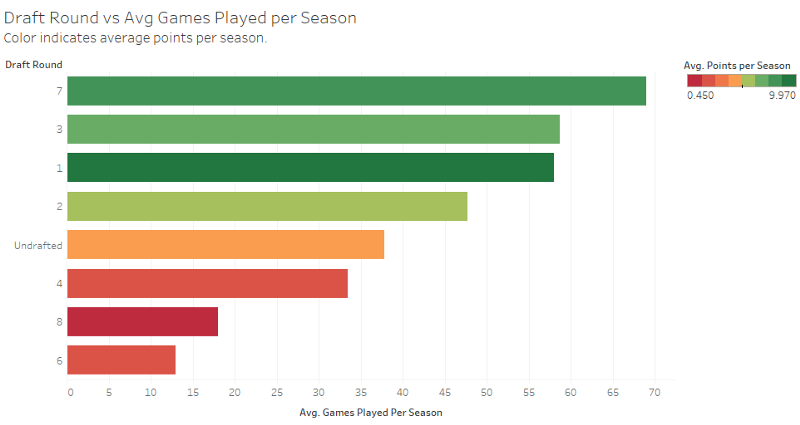
Not necessarily.
1st round picks only play the 3rd most number of games, while 7th and 3rd round picks play more games on average per season.
But in terms of average points per season (the colors in the plot), the 1st round picks contribute the most points. Could this be because 1st round picks are rested a bit more to score more efficiently in crucial and important games for the team?
Another interesting insight, being undrafted helps you play more games than being a 4th, 6th or 8th round pick. Surprising.
The Biggest of the Biggest
So the player has been drafted. Chances are he’s really tall and really strong. The NBA’s known for having the tallest and strongest players, real athletic specimens.
In fact, the average height and weight of the players since 1996 are 200.8 cm (6'5’’) and 100.6 kg (221.7 lbs).
3. Who were the biggest players out of all of them?
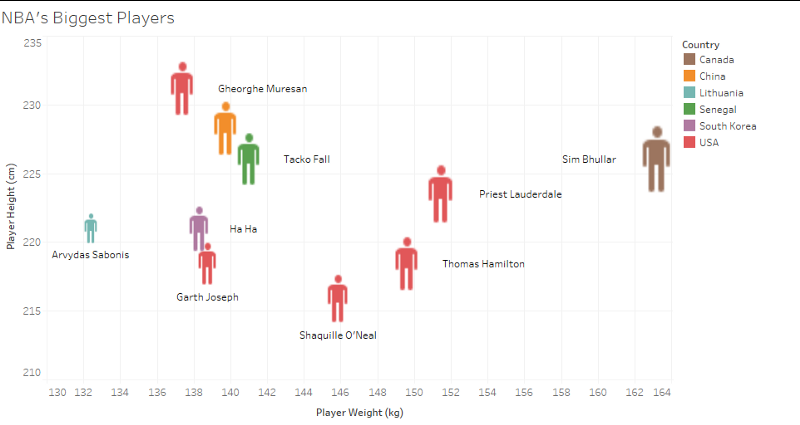
As most of the players in the NBA do come from the USA, it’s definitely no surprise that some of the biggest players are from the USA as well.
But it looks like one of the biggest ever was Sim Bhullar from Canada (who was actually the first Indian-origin player in the NBA), who was 2.26m (7’5’’) and 163 kg (359 lbs).
Shaquille O’Neal, known as one of the best “big guys” in the NBA, was 2.15m (7’1’’) and 145 kg (319 lbs). Yao Ming (the unlabeled orange icon in the graph) was also one of the best “big guys”, and was 2.29m (7'6’’) and 141 kg (310 lbs)
The Most Important Team Statistic?
Teams can be measured in many different ways, each bringing out different insights. But arguably, one of the most important is “Net Rating”. Net rating refers to the team’s point differential per 100 possessions.
4. Which team has the best and worst Net Rating?
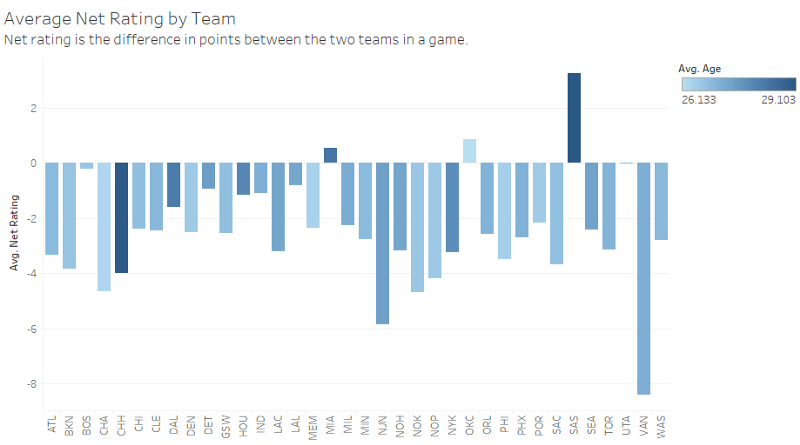
Turns out, the San Antonio Spurs have the best Net Rating on average, since 1996, with +3.24, meaning on average, for every 100 possessions, they’re ahead by 3 points. Only 2 other teams have positive Net Ratings, the Miami Heat and Oklahoma City Thunder. The worst team is the now defunct Vancouver Grizzlies, with -8.39.
Another surprising insight is that the San Antonio Spurs were also the oldest team on average, over all the seasons. Does experience, in the form of having an older team, actually work? That’s probably the basis for another analysis.
The Best Offensive Players
(Disclaimer: These statistics are from 1996 onwards, so with only about half of Michael Jordan’s career recorded here, he’s not on these lists, but with a bigger dataset, you can be sure he’d be right up there.)
There are so many metrics that individual players can be measured by. For an offensive player, the player in charge of trying to create as many baskets as possible, the most used and analyzed metrics are Points and Assists.
5. Which players have the most Points and Assists?
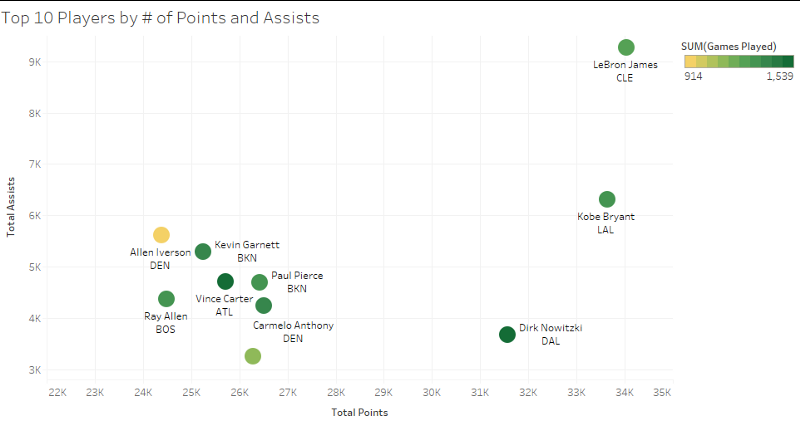
LeBron James, in a complete league of his own, a complete outlier, well above the rest of the pack with a whopping 34,027 points and 9,280 assists. Kobe Bryant (RIP Mamba) is the only one who can come close to LBJ with 33,633 points and 6,319 assists. (I Googled Michael Jordan’s stats for completeness and he would come somewhere around third, with 32,292 points and 5,633 assists)
Other notable players on the list are Dirk Nowitzki, with 31,561 points, and 3,667 assists, and Allen Iverson, who’s played the least number of games out of everyone on this graph, with 24,380 points and 5,622 assists in just 914 games. (In comparison, LeBron’s played 1,256 games, Kobe’s played 1,346 games and Dirk’s played 1,522 games).
— — — — — — — — — — — — — — — — — — — — — — — — — —
Using points and assists in a different way can bring out more insights. Using total shooting efficiency of a player and the percentage of assists by the player while on the floor, a completely different set of players show up.
6. Which players had the highest Shooting Efficiency and Assist Percentage?
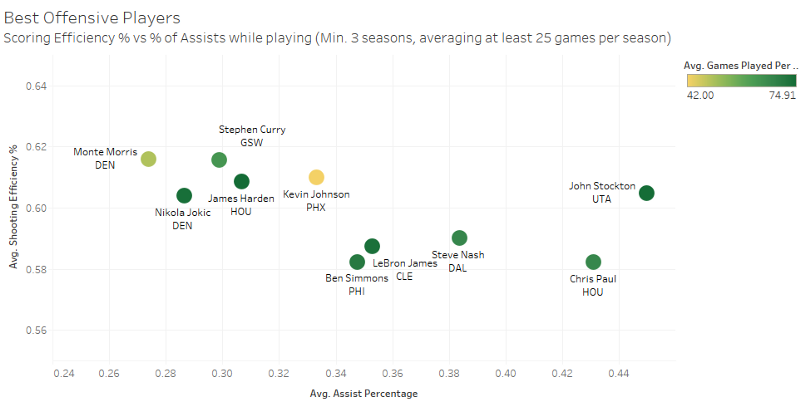
John Stockton seems almost like an outlier, with a high shooting efficiency and high average assist percentage. But the repetition of certain players in this graph, such as Steph Curry, James Harden, LeBron James and Chris Paul, showcases their superior shooting ability. Also younger, current players like Ben Simmons and Nikola Jokic, are definitely on the rise and will soon dominate these statistics with consistent perfomances.
— — — — — — — — — — — — — — — — — — — — — — — — — —
Play usage percentage is an estimate of the percentage of team plays used by a player while he was on the floor. Typically, when the play usage percentage increases, the scoring efficiency decreases for a player. The real superstar players are those who can keep both these numbers up, turning into very efficient shooters.
7. Who were the most effective shooters?
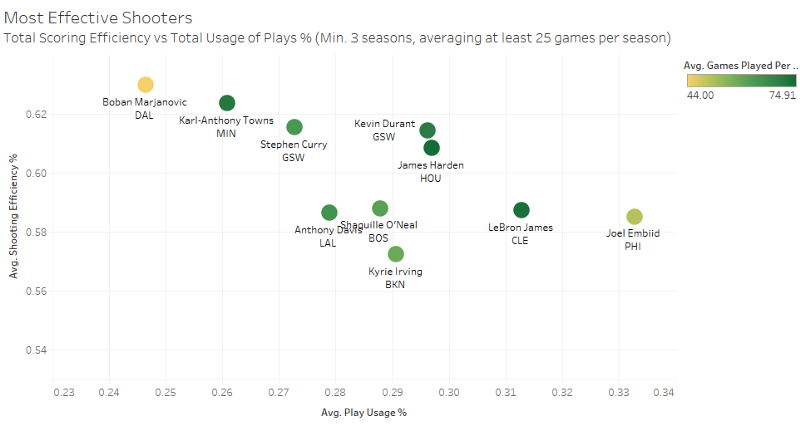
Joel Embiid has the highest average play usage percentage, while Boban Marjanovic has the highest average shooting percentage.
But the most effective superstar shooters seem to be Kevin Durant, James Harden and LeBron James, due to their all-round ability in using plays and having a high shooting efficiency.
Closely following them are Anthony Davis, Shaquille O’Neal and Steph Curry.
The Best Defensive Players
Although typically overlooked, defensive players are those who do most of the grunt work and actively contribute to the success of a team. Without a great defensive player, no matter how many great offensive players you might have, you’ll end up on the worse side of things.
Rebounds are another important metric for measuring the efficiency of these defensive, lockdown players. A Rebound refers to a player retrieving the ball after a missed field goal or free throw.
There are 2 types of rebounds, offensive and defensive. A superstar defensive player ideally has a high number of both types of rebounds.
8. Who were the best players defensively, in terms of rebounds?
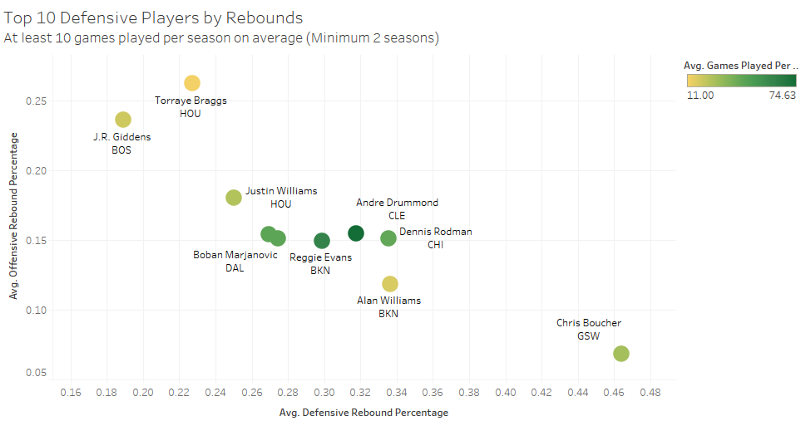
With at least 10 games played per season on average, and a minimum of 2 seasons, these were the top 10 defensive players in terms of rebounds.
The best defensive rebounder was Chris Boucher, and the best offensive rebounders were J.R Giddens and Torraye Braggs.
But what matters most in a defender is their all-round ability, and the best players in terms of both offensive and defensive rebounds are Dennis Rodman and Andre Drummond.
Double Double Trouble Trouble
Another metric used very often is the “Double Double”, when a player has more than 10 points in 2 of the following metrics: points, assists, rebounds, steals and blocks.
Most Doubles Doubles are typically made of points, assists and rebounds, which I’ve referred to here as “Most Common Double Double”.
9. Which players had the most seasons averaging the “Most Common” Double Double?
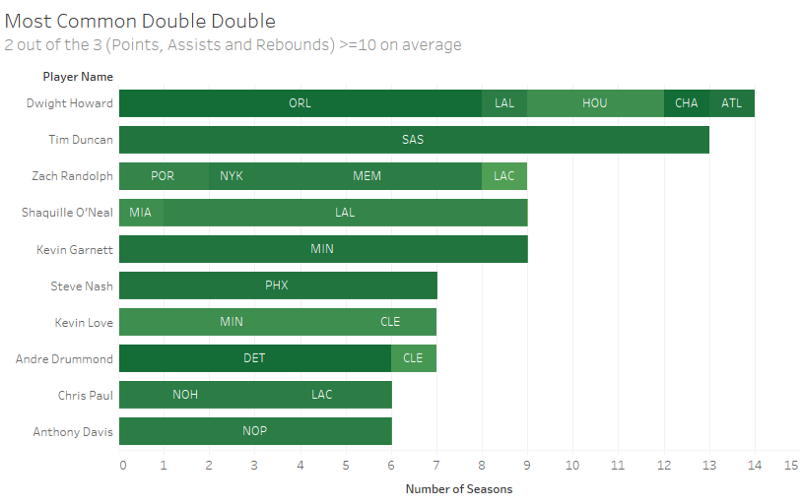
Dwight Howard (14 Double Double seasons) narrowly edges over Tim Duncan (13 Double Double seasons) to have the highest number of seasons averaging the “Most Common” Double Double.
Anthony Davis, a younger and current player, also being on this list indicates that with a couple of great seasons, he has a very good chance of moving up this list.
And it’s amazing how Chris Paul features in this graph as well, showcasing his brilliant shooting ability as well as his all-rounded abilities.
The Evolving Game?
There have been many conversations on how the game has changed over time. Many people think the aggressiveness and intensity has decreased over time, while others believe that the game has evolved into a more graceful and watchable format.
Arguably, some of the most important metrics used so far were Points, Assists and Rebounds.
10. How much have these important metrics (Points, Assists, Rebounds) actually changed over time?
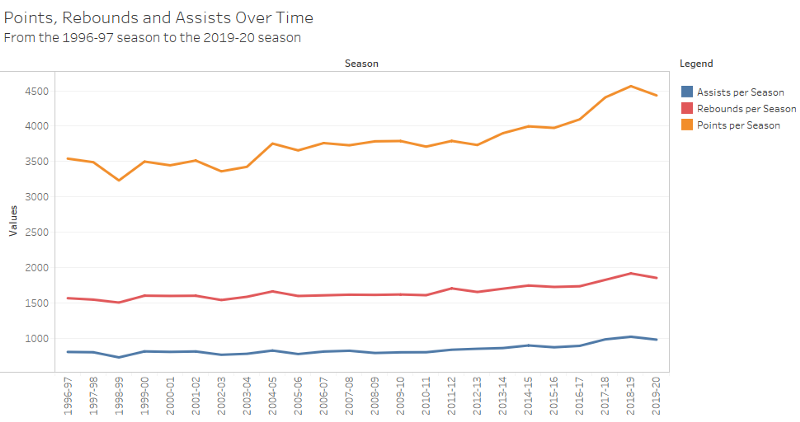
Total assists per season and total rebounds per season seem constant for the most part, with a slightly increasing tendency.
Total points per season, on the other hand, has significantly increased. The 1996–97 season had a total of 3,540 points whereas the 2018–19 season had 4,565 points. Even the incomplete 2019–20 season already has 4,434 points, well on track to go past the 2018–19 season, becoming the highest scoring season of all time (whenever and however the season resumes).
This increase in points could be attributed to the rise of the 3-Pointer revolution, with more and more 3-Pointers being scored now than ever before. It could also be due to the fact that there are a lot more high scoring matches now than before.
Conclusion
I hope you were able to take away some kind of insight from these graphs, because I certainly did. It’s just another way of showing that the best way to learn is by doing.
I’m open to any kind of suggestions or modifications to these visualizations, or ideas for new ones. Definitely do use them in whatever basketball conversations and arguments you have, as you see fit.
And I hope it helps fill the void left by the lack of sports right now. (Come back soon, normal life)
Feel free to reach out to me on LinkedIn, or check out my GitHub for other projects I’ve done.